Meta-analysis: agent survival time in different matrices
The reported survival times for the virus in different matrices was subjected to meta-analysis to account explicitly for the effect of censoring, that is, studies which were interrupted while the agent was still detectable in the matrices investigated.
ONLY STUDIES WITH TEMPERATURE BETWEEN 0 AND 30 DEGREES CELSIUS (materials not frozen or heated) are eligible, as comparisons among studies with larger temperature variation would not be meaningful.
Studies confirming virus detection and studies in which detection was based on genetic material (DNA/RNA) were evaluated separately.
Plots show the parametric confidence intervals for the mean survival time when at least 4 study groups are reported. The plots are then repeated presenting interquartile ranges (IQ, Q1-Q3). Following the plots, a table gives the exact number for these intervals for each of the matrices reported. For the raw data (all study groups reported individually), see download link on the left panel.
Virus Detection (0-30 degrees Celsius) (PARAMETRIC intervals)
Survival per matrix

More matrices

Virus detection (0-30 degrees Celsius) (IQ range)
Survival per matrix
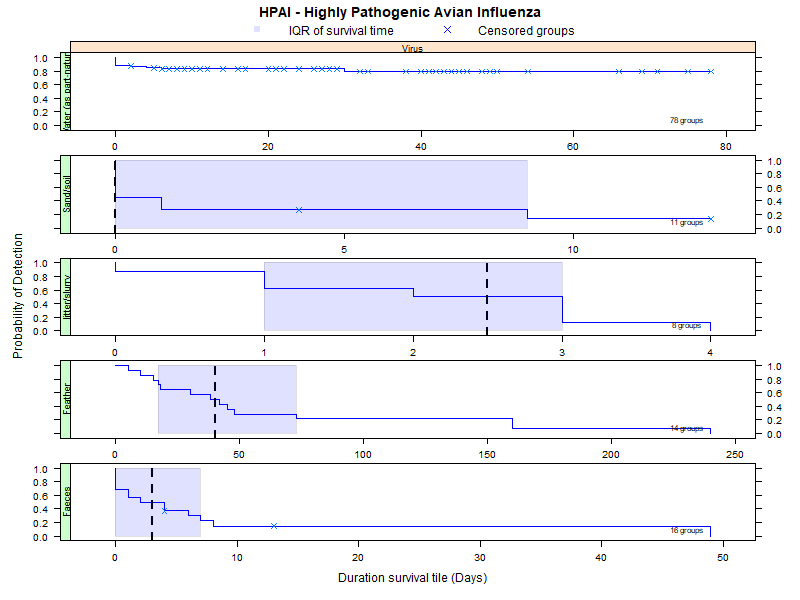
More matrices

DNA/RNA detection (0-30 degrees Celsius) (PARAMETRIC intervals)
Survival per matrix

DNA/RNA detection (0-30 degrees Celsius) (IQ range)
Survival per matrix
